Observability#
edg exposes Prometheus metrics so you can monitor workload performance in real time using Grafana, Prometheus, or any compatible tool.
Enabling the metrics endpoint#
Pass --metrics-addr to start an HTTP server that serves Prometheus metrics at /metrics:
edg run \
  --driver pgx \
  --config workload.edg \
  --url ${DATABASE_URL} \
  --metrics-addr :9090 \
  -w 10 \
  -d 5m
Verify with:
curl -s localhost:9090/metrics | grep edg_The flag works with any command that runs a workload (run, all, and built-in workloads like workload bank run).
Metrics reference#
edg_query_duration_seconds (histogram)#
Latency of each query or transaction execution, in seconds.
| Sub-metric | Meaning |
|---|---|
edg_query_duration_seconds_bucket | Histogram buckets for latency distribution |
edg_query_duration_seconds_count | Total number of completed queries |
edg_query_duration_seconds_sum | Cumulative query time in seconds |
Labels: query (the query or transaction name from your config).
Example output:
edg_query_duration_seconds_bucket{query="check_balance",le="0.005"} 4821
edg_query_duration_seconds_bucket{query="check_balance",le="0.01"} 9430
edg_query_duration_seconds_bucket{query="check_balance",le="0.025"} 12001
edg_query_duration_seconds_bucket{query="check_balance",le="+Inf"} 12050
edg_query_duration_seconds_count{query="check_balance"} 12050
edg_query_duration_seconds_sum{query="check_balance"} 48.372
edg_query_errors_total (counter)#
Total number of failed query executions.
Labels: query.
edg_query_errors_total{query="credit_account"} 3edg_transaction_commits_total (counter)#
Total number of committed transactions.
Labels: query.
edg_transaction_commits_total{query="make_transfer"} 5812edg_transaction_rollbacks_total (counter)#
Total number of rolled-back transactions.
Labels: query.
edg_transaction_rollbacks_total{query="make_transfer"} 47edg_workers (gauge)#
Number of concurrent workers. Updated when a stage starts.
edg_workers 10Useful PromQL queries#
Queries per second (QPS)#
rate(edg_query_duration_seconds_count{query="check_balance"}[1m])Transactions per second (TPS)#
rate(edg_transaction_commits_total{query="make_transfer"}[1m])Average latency#
rate(edg_query_duration_seconds_sum[1m])
  / rate(edg_query_duration_seconds_count[1m])
p50 / p95 / p99 latency#
histogram_quantile(0.50, rate(edg_query_duration_seconds_bucket[1m]))
histogram_quantile(0.95, rate(edg_query_duration_seconds_bucket[1m]))
histogram_quantile(0.99, rate(edg_query_duration_seconds_bucket[1m]))
Per-query percentiles:
histogram_quantile(0.99,
  rate(edg_query_duration_seconds_bucket{query="check_balance"}[1m])
)
Error rate (percentage)#
rate(edg_query_errors_total[1m])
  / rate(edg_query_duration_seconds_count[1m]) * 100
Rollback ratio#
rate(edg_transaction_rollbacks_total{query="make_transfer"}[1m])
  / (
    rate(edg_transaction_commits_total{query="make_transfer"}[1m])
    + rate(edg_transaction_rollbacks_total{query="make_transfer"}[1m])
  )
Prometheus scrape config#
Add edg as a target in your prometheus.yml:
scrape_configs:
  - job_name: edg
    scrape_interval: 5s
    static_configs:
      - targets: ["localhost:9090"]
Grafana dashboard tips#
A practical edg dashboard might include the following panels:
| Panel | PromQL | Visualisation |
|---|---|---|
| QPS by query | rate(edg_query_duration_seconds_count[1m]) | Time series, one line per query |
| p99 latency by query | histogram_quantile(0.99, rate(edg_query_duration_seconds_bucket[1m])) | Time series |
| Error rate | rate(edg_query_errors_total[1m]) | Time series or stat |
| Workers | edg_workers | Stat or gauge |
| Commit vs rollback | rate(edg_transaction_commits_total[1m]) and rate(edg_transaction_rollbacks_total[1m]) | Stacked time series |
Here’s an example Grafana dashboard built from these panels, visualising a bank workload running against CockroachDB:
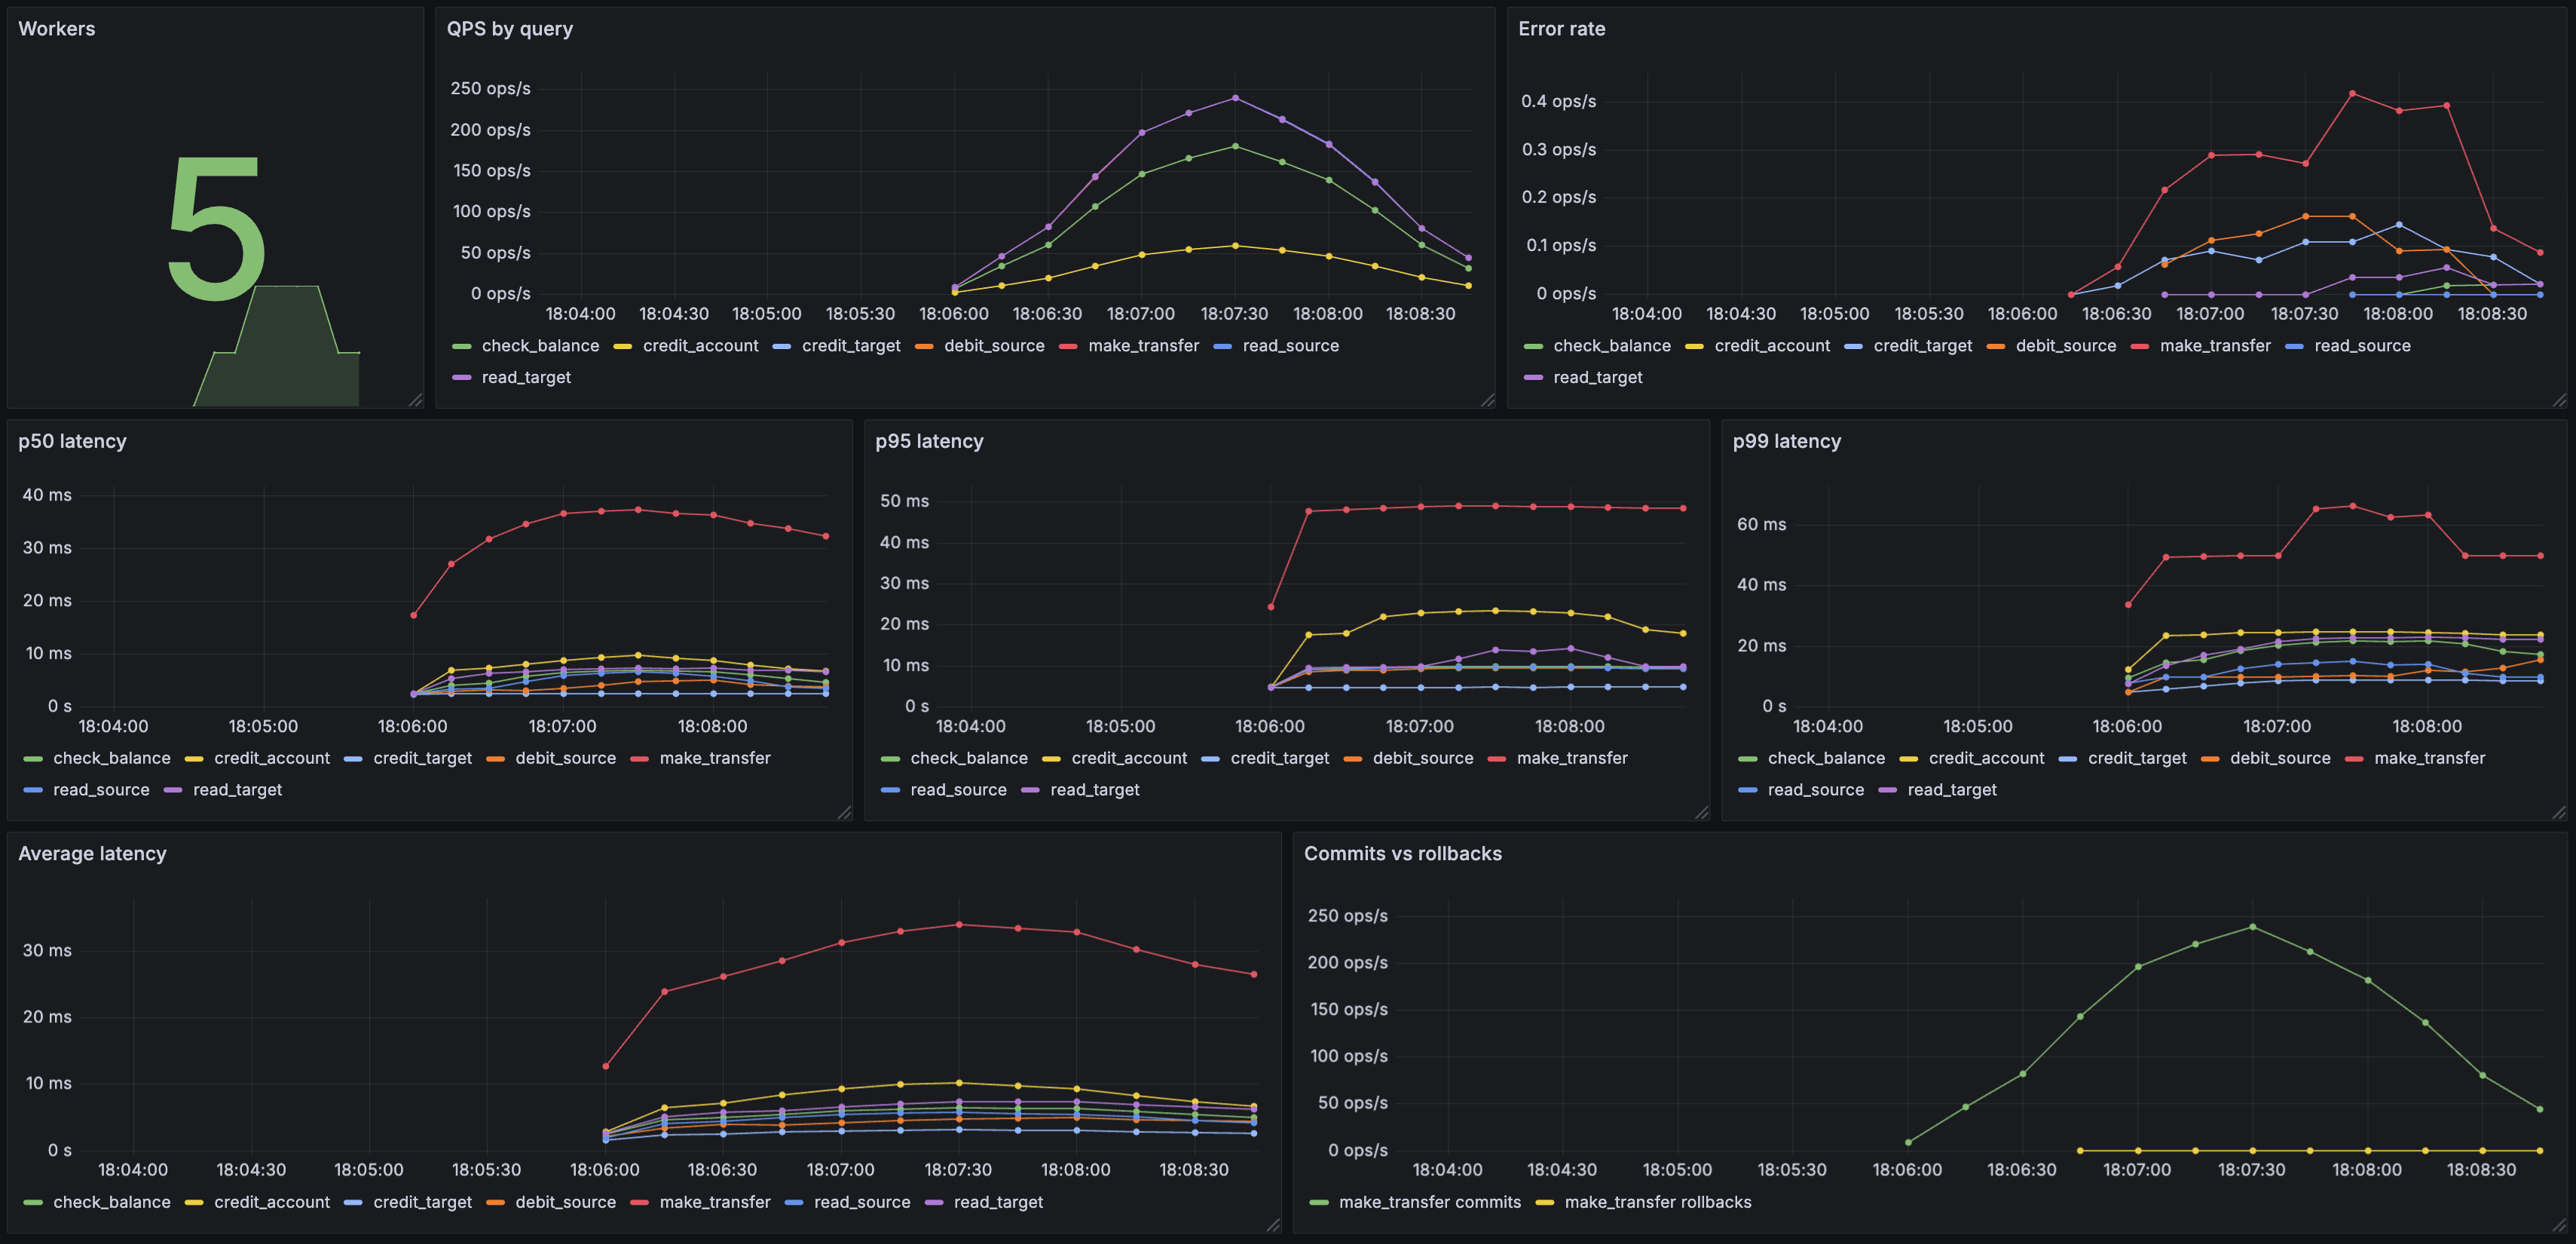
The histogram uses Prometheus default buckets (5ms to 10s). If your queries are consistently faster than 5ms or slower than 10s, consider adjusting the bucket boundaries in the source to get more useful percentile estimates.
Combining with expectations#
Prometheus metrics and expectations serve complementary purposes. Expectations give you a pass/fail gate at the end of a run (useful in CI). Prometheus metrics give you continuous visibility into how the workload behaves over time (useful for load testing and debugging).
Run both together:
edg all \
  --driver pgx \
  --config workload.edg \
  --url ${DATABASE_URL} \
  --metrics-addr :9090 \
  -w 10 \
  -d 5m
Watch the Grafana dashboard while the run executes, and let expectations catch regressions automatically.
Full example#
The examples/observability directory contains a complete setup with Docker Compose (CockroachDB + Prometheus + Grafana), a pre-built Grafana dashboard, and a bank workload with queries, writes, and transactions that occasionally roll back (so every metric type is visible).